
Autoscaling is natively supported on Kubernetes. Since 1.7 release, Kubernetes added a feature to scale your workload based on custom metrics. Prior release only supported scaling your apps based on CPU and memory.
Kubernetes 1.7 introduced "Aggregator Layer" which allows Kubernetes to be extended with additional APIs, beyond what is offered by the core Kubernetes APIs. This gives you the power to enable your own custom APIs.
In this guide, we are going to understand the basics of HPAs, custom, external metrics APIs working and scaling workloads based on external metrics scraped from Kafka Cluster.
The following are the steps you will complete in this guide:
- Step 1: Enable cluster monitoring for Stackdriver.
- Step 2: Deploy a custom API server and register it to the aggregator layer.
- Step 3: Deploy metrics exporter and write to Stackdriver.
- Step 4: Deploy a sample application written in Golang to test the autoscaling.
- Step 5: Write a custom metrics based HPA to scale application.
We need to cover some concepts which are good to know before we move forward to the demonstration.
How Kubernetes HPA works?
The Horizontal Pod Autoscaler is implemented as a Kubernetes API resource and a controller. The resource determines the behaviour of the controller. The controller periodically adjusts the number of replicas in a replication controller or deployment.
The HorizontalPodAutoscaler normally fetches metrics from a series of aggregated APIs (metrics.k8s.io, custom.metrics.k8s.io and external.metrics.k8s.io). The metrics.k8s.io API is usually provided by metrics-server, which needs to be launched separately. The HorizontalPodAutoscaler can also fetch metrics directly from Heapster.
Here, in this guide, we will deploy our HPA reading from external.metrics.k8s.io as our kafka metrics will be exposed to that API.
What is custom metrics?
Kubernetes allows us to deploy your own metrics solutions. By default, metrics-server and heapster act as core metrics backend.
Kubernetes has extended the support to allow custom APIs to expose other metrics provider. Few adapters are written by the third party to implement custom APIs which can be used to expose these metrics to Kubernetes resources such like HPA.
Current Implementations: github.com/Kubernetes/IMPLEMENTATIONS.md
How custom API server and HPA ties together ?
The custom API server that we deploy registers an API to Kubernetes and allows the HPA controller query custom metrics from that. API server that we are going to deploy here is Stackdriver adapter which can collect metrics from Stackdriver and send them to the HPA controller via REST queries.
Our custom API server will register two APIs to Kubernetes : custom.metrics.k8s.io and external.metrics.k8s.io.
We will be also deploy an application to write metrics (in this case kafka metrics) to google stackdriver. The kind of metrics which we are going to write to Stackdriver will be exposed under external.metrics.k8s.io instead of custom.metrics.k8s.io.
Prerequisites
Ensure the following dependencies are already fulfilled:
- You have a Docker running. You know the rules of this game. ;)
- You have a Kubernetes cluster (GKE) running on GCP.
- You have kubectl CLI installed and configured to your GKE cluster.
Let's begin the demonstration.
1. Enable cluster monitoring for Stackdriver
GCP helper docs : https://cloud.google.com/Kubernetes-engine/docs/how-to/monitoring
Monitoring scope should be enabled on cluster nodes. It is enabled by default, so you need not do anything. If you have an older version, upgrade it to the latest version and then update your node version as well. The scope will enable write permission to stackdriver which is important for writing metrics.
$ gcloud container clusters list
NAME                 LOCATION       MASTER_VERSION  MASTER_IP       MACHINE_TYPE   NODE_VERSION   NUM_NODES  STATUS
my-kube-cluster  us-central1-b  1.10.7-gke.11   xxx.xxx.xxx.xxx  n1-standard-1    1.10.7-gke.11    2          RUNNING


$ gcloud container clusters describe my-kube-cluster
............
..<output>..
............
oauthScopes:
    - https://www.googleapis.com/auth/compute
    - https://www.googleapis.com/auth/devstorage.read_only
    - https://www.googleapis.com/auth/service.management
    - https://www.googleapis.com/auth/servicecontrol
    - https://www.googleapis.com/auth/logging.write
    - https://www.googleapis.com/auth/monitoring   # enabled
............
..<output>..
............
2. Deploy a custom API server and register it to the aggregator layer.
Before we deploy our custom server, let's see what APIs are available in our k8s.
## Type commands to see existing available APIs
$ kubectl api-versions

admissionregistration.k8s.io/v1beta1
apiextensions.k8s.io/v1beta1
apiregistration.k8s.io/v1
apiregistration.k8s.io/v1beta1
............
..<other-APIs>..
............
metrics.k8s.io/v1beta1    # this is our core metrics APIs
............
..<other-APIs>..
............
Here, you can see we have metrics.k8s.io but we need external.metrics.k8s.io to expose our stackdriver metrics and allow HPA to read it through.
We are going to use custom metrics stackdriver adapter to register our APIs.
# Use one of google user account to create a cluster role
$ kubectl create clusterrolebinding cluster-admin-binding \
    --clusterrole cluster-admin --user "$(gcloud config get-value account)"

# We will deploy new resource model based APIs

$ kubectl apply -f https://raw.githubusercontent.com/GoogleCloudPlatform/k8s-stackdriver/master/custom-metrics-stackdriver-adapter/deploy/production/adapter_new_resource_model.yaml

namespace "custom-metrics" created
serviceaccount "custom-metrics-stackdriver-adapter" created
clusterrolebinding.rbac.authorization.k8s.io "custom-metrics:system:auth-delegator" created
rolebinding.rbac.authorization.k8s.io "custom-metrics-auth-reader" created
clusterrolebinding.rbac.authorization.k8s.io "custom-metrics-resource-reader" created
deployment.extensions "custom-metrics-stackdriver-adapter" created
service "custom-metrics-stackdriver-adapter" created
apiservice.apiregistration.k8s.io "v1beta1.custom.metrics.k8s.io" created
apiservice.apiregistration.k8s.io "v1beta1.external.metrics.k8s.io" created
clusterrole.rbac.authorization.k8s.io "external-metrics-reader" created
clusterrolebinding.rbac.authorization.k8s.io "external-metrics-reader" created
Now, we have deployed our custom server and registered APIs to Aggregator Layer.
# Custom Metrics APIs verification

$  kubectl get all -n custom-metrics
NAME                                                 READY     STATUS    RESTARTS   AGE
custom-metrics-stackdriver-adapter-6c9bd9679-m2cnh   1/1       Running   0          2m

# Type again to get available APIs
$ kubectl api-versions
............
..<other-APIs>..
............
metrics.k8s.io/v1beta1
.....
custom.metrics.k8s.io/v1beta1   # for custom Kubernetes metrics
external.metrics.k8s.io/v1beta1 # for external metrics
............
..<other-APIs>..
............
Now, query our new APIs which just came online.
$ kubectl get --raw "/apis/external.metrics.k8s.io/v1beta1" | jq
$ kubectl get --raw "/apis/custom.metrics.k8s.io/v1beta1" | jq
Now you can see, both APIs are available are online with a lot of custom metrics are available for query. Next, we will be writing kafka metrics to stackdriver and these APIs will help us read from it.
Resource in details : k8s-stackdriver/custom-metrics-stackdriver-adapter
3. Deploy metrics exporter and write to stackdriver.
We are using Kafka exporter which will read my kafka cluster and expose metrics in prometheus format and we combine our deployment with this k8s-stackdriver/prometheus-to-sd sidecar container. Kafka-exporter will read the Kafka cluster and expose the metrics on particular web-URL and our sidecar container will read those and write to stackdriver. Easy enough, let's do it.
# prometheus-to-sd-custom-metrics-kafka-exporter.yaml
apiVersion: extensions/v1beta1
kind: Deployment
metadata:
  name: custom-metrics-kafka-exporter
spec:
  replicas: 1
  selector:
    matchLabels:
      custom: metrics
  template:
    metadata:
      labels:
        custom: metrics
    spec:
      hostNetwork: true
      containers:
      - name: kafka-exporter
        image: danielqsj/kafka-exporter
        command:
        - kafka_exporter
        - "--kafka.server=my-kafka-broker-1:9092"
        - "--kafka.server=my-kafka-broker-2:9092"
        ports:
          - name: http-metrics
            containerPort: 9308
        readinessProbe:
          httpGet:
            path: /
            port: 9308
          initialDelaySeconds: 5
          timeoutSeconds: 5
      - name: prometheus-to-sd
        image: gcr.io/google-containers/prometheus-to-sd:v0.3.2
        ports:
          - name: profiler
            containerPort: 6060
        command:
          - /monitor
          - --stackdriver-prefix=custom.googleapis.com
          - --source=kafka-exporter:http://localhost:9308?whitelisted=kafka_brokers,kafka_topic_partitions,kafka_consumergroup_current_offset_sum,kafka_consumergroup_lag_sum
          - --pod-id=$(POD_NAME)
          - --namespace-id=$(POD_NAMESPACE)
        env:
          - name: POD_NAME
            valueFrom:
              fieldRef:
                fieldPath: metadata.name
          - name: POD_NAMESPACE
            valueFrom:
              fieldRef:
                fieldPath: metadata.namespace
Deploy this to ship your metrics to stackdriver.
kubectl apply -f prometheus-to-sd-custom-metrics-kafka-exporter.yaml
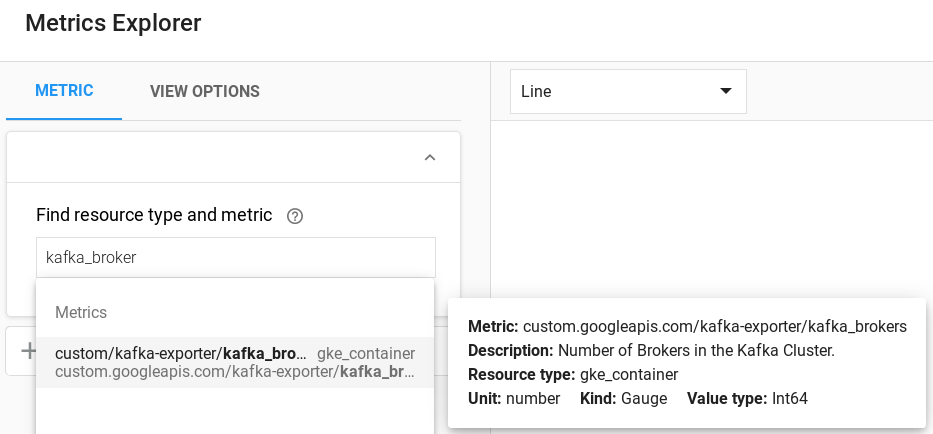
Next step is exploring stackdriver and filter your external metrics. Available metrics : https://github.com/danielqsj/kafka_exporter#metrics
For example search : kafka_brokers
You can also query registered APIs to read these external values.
$ kubectl get --raw "/apis/external.metrics.k8s.io/v1beta1/namespaces/default/custom.googleapis.com|kafka-exporter|kafka_brokers" | jq

{
  "kind": "ExternalMetricValueList",
  "apiVersion": "external.metrics.k8s.io/v1beta1",
  "metadata": {
    "selfLink": "/apis/external.metrics.k8s.io/v1beta1/namespaces/default/custom.googleapis.com%7Ckafka-exporter%7Ckafka_brokers"
  },
  "items": [
    {
      "metricName": "custom.googleapis.com|kafka-exporter|kafka_brokers",
      "metricLabels": {
        "resource.labels.cluster_name": "my-kube-cluster",
        "resource.labels.container_name": "",
        "resource.labels.instance_id": "gke-my-kube-cluster-69201eb2-dvdg",
        "resource.labels.namespace_id": "default",
        "resource.labels.pod_id": "custom-metrics-kafka-exporter-56764bbbc9-p5xqb",
        "resource.labels.zone": "us-central1-b",
        "resource.type": "gke_container"
      },
      "timestamp": "2018-12-25T12:56:46Z",
      "value": "2"
    }
  ]
}
4. Deploy a sample application written in golang to test autoscaling.
Till now, we went through all the sophisticated pieces of stuff which will help to expose our metrics to HPA. From now on, we will run some basic ops that we usually do in Kubernetes.
To simulate the autoscaling, I have deployed a sample application written in golang which will act as Kafka client ( producer and consumer ) for Kafka topics.
Code for reference : k8s-hpa-custom-autoscaling-kafka-metrics/go-kafka
$ kubectl get deploy -llang=golang
NAME                       DESIRED   CURRENT   UP-TO-DATE   AVAILABLE   AGE
consumer-kafka-go-client   1         1         1            1           25m
producer-kafka-go-client   1         1         1            1           30m

# scaling the producer app to build a consumer lag on kafka topic
$ kubectl scale --replicas=2 deployment/producer-kafka-go-client
I have scaled my producer so that it will push enough messages to build lag for my consumer clients and we will test our HPA on consumer deployment.
5. Write a custom metrics based HPA to scale application.
Now that I have scaled my Kafka producer, there should be a consumer lag build up in the Kafka topic. We have prepared HPA to read from external metrics coming from stackdriver through our newly registered APIs. All the hard work above is for this moment.
Below is my HPA manifest file, which is going to help scale our Kafka consumer :
# kafka-custom-metrics-hpa.yaml
apiVersion: autoscaling/v2beta1
kind: HorizontalPodAutoscaler
metadata:
  name: consumer-kafka-go-client
spec:
  minReplicas: 1
  maxReplicas: 5
  metrics:
  - type: External
    external:
      # which metrics to read from stackdriver
      metricName: custom.googleapis.com|kafka-exporter|kafka_consumergroup_lag_sum
      metricSelector:
        matchLabels:
          # define labels to target
          metric.labels.consumergroup: golang-consumer
      # scale +1 whenever it crosses multiples of mentioned value
      targetAverageValue: "1000"
  # define deployment to control
  scaleTargetRef:
    apiVersion: extensions/v1beta1
    kind: Deployment
    name: consumer-kafka-go-client
$ kubectl apply -f kafka-custom-metrics-hpa.yaml
horizontalpodautoscaler.autoscaling "consumer-kafka-go-client" configured
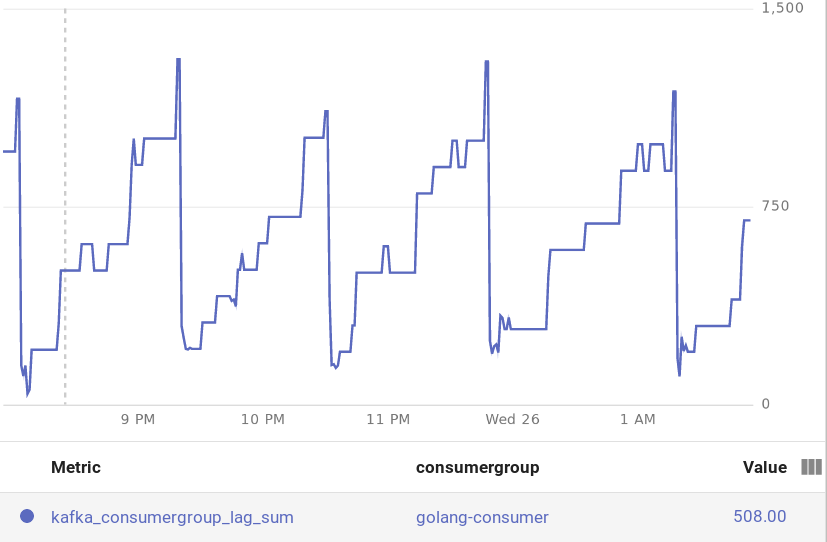
Let's query our kafka_consumer_lag to see what are the current stats.
 kubectl get --raw "/apis/external.metrics.k8s.io/v1beta1/namespaces/default/custom.googleapis.com|kafka-exporter|kafka_consumergroup_lag_sum" | jq

{
  "kind": "ExternalMetricValueList",
  "apiVersion": "external.metrics.k8s.io/v1beta1",
  "metadata": {
    "selfLink": "/apis/external.metrics.k8s.io/v1beta1/namespaces/default/custom.googleapis.com%7Ckafka-exporter%7Ckafka_consumergroup_lag_sum"
  },
  "items": [
    {
      "metricName": "custom.googleapis.com|kafka-exporter|kafka_consumergroup_lag_sum",
      "metricLabels": {
        "metric.labels.consumergroup": "golang-consumer",
        "metric.labels.topic": "custom-topic",
        "resource.labels.container_name": "",
        "resource.labels.namespace_id": "default",
        "resource.labels.pod_id": "custom-metrics-kafka-exporter-547c7f4d5c-tqtw8",
        "resource.labels.zone": "us-central1-b",
        "resource.type": "gke_container"
      },
      "timestamp": "2018-12-25T18:46:54Z",
      "value": "732"
    }
  ]
}
After polling some stats for a while, I saw auto scale trigger after some time. Yey!! In this case, it scaled the app to 4 replicas based on the numbers found on stackdriver.
$ kubectl get hpa
NAME                       REFERENCE                             TARGETS        MINPODS   MAXPODS   REPLICAS   AGE
consumer-kafka-go-client   Deployment/consumer-kafka-go-client   732/1k (avg)   1         5         1          4m

$ kubectl get hpa
NAME                       REFERENCE                             TARGETS         MINPODS   MAXPODS   REPLICAS   AGE
consumer-kafka-go-client   Deployment/consumer-kafka-go-client   4032/1k (avg)   1         5         1          12m

$ kubectl get hpa
NAME                       REFERENCE                             TARGETS         MINPODS   MAXPODS   REPLICAS   AGE
consumer-kafka-go-client   Deployment/consumer-kafka-go-client   1008/1k (avg)   1         5         4          13m
Custom autoscaling is a very useful feature when you wanted to scale your workloads based on the complexity of your works deployed in your production. It could be disk size, networking, Loadbalancers connections etc.
Hope you enjoyed this guide. Give thumbs up and ask questions in the comments.
Github : https://github.com/sunnykrGupta/k8s-hpa-custom-autoscaling-kafka-metrics
Resources :
- prometheus-to-sd
- kafka_exporter
- run-application/horizontal-pod-autoscale
- custom-metrics-stackdriver-adapter
- https://cloud.google.com/Kubernetes-engine/docs/tutorials/external-metrics-autoscaling
- https://Kubernetes.io/docs/concepts/extend-Kubernetes/api-extension/apiserver-aggregation/
- autoscaling-on-metrics-not-related-to-Kubernetes-objects
Share on:


